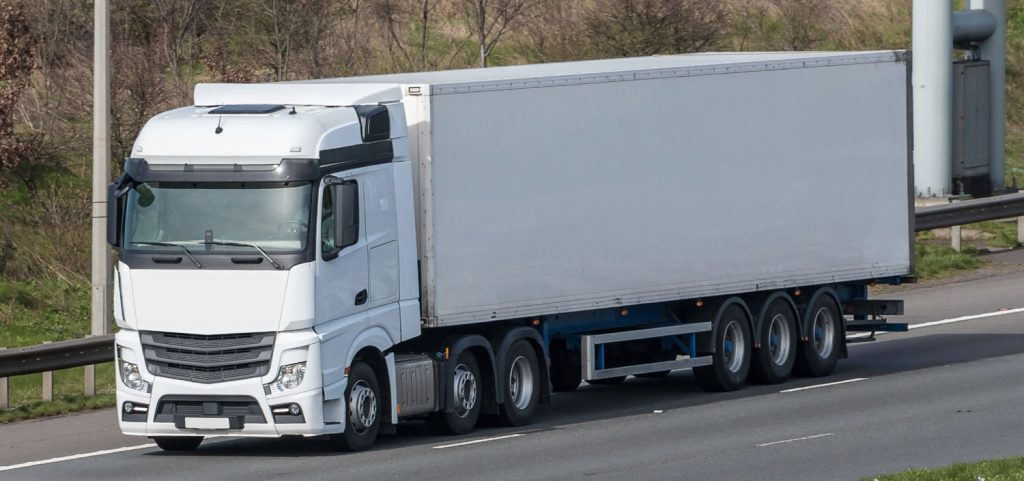
Heavy Goods Vehicles (HGVs) defined as commercial vehicles over 3.5 tonnes Gross Vehicle Weight (GVW), account for 17% of UK road transport GHG emissions and 21% of road transport NOx emissions. There has been limited success at developing alternatives to fossil fuel for heavy trucks primarily because of their significant power demands and requirement to travel long distances.
This is part 1 of a seven part series which explores some of the issues around zero carbon vehicles and which future technologies might be best for HGVs to avoid carbon emissions. The seven parts are:
- Understanding the Typical Power Requirements of an HGV (this post)
- Basic Designs of Diesel, Battery and Fuel Cell Powertrains
- Comparing Diesel, Battery and Fuel Cell Powertrains
- Assessing Future Manufacturing Costs of Diesel, Battery and Fuel Cell Powertrains for HGVs
- Costs of Hydrogen Fuel / Building A Hydrogen & Electric Charging Infrastructure
- Commercial Viability of Operating A Battery or Fuel Cell Powertrain HGV
- Summary, A Look at Developments Which May Help Achievement of Zero Carbon In-use HGVs.
To illustrate the challenges, the article focuses mainly on long haul trucks covering 800-1,500km distances of 40 tonne GVW.
Part 1: The Power Requirements of An HGV
1.1 What Are The Power Requirements of An HGV?
Trucks need power for three main reasons:
- Providing the motive power to move the truck itself
- Providing power for the other systems used by the truck, such as braking, engine cooling, fuel pumps and compressors. These are often known as Balance of Plant (BoP)
- Providing power to support auxiliary loads either to support the driver (such as lighting, air-conditioning & heating) or to support the cargo itself (such as power for refrigeration).
The motive power requirements are by far the biggest and can be considered as two elements:
- Peak power required to climb gradients
- Average power over a typical journey, which will include periods of acceleration, steady speed and braking.
1.2 HGV Peak Power
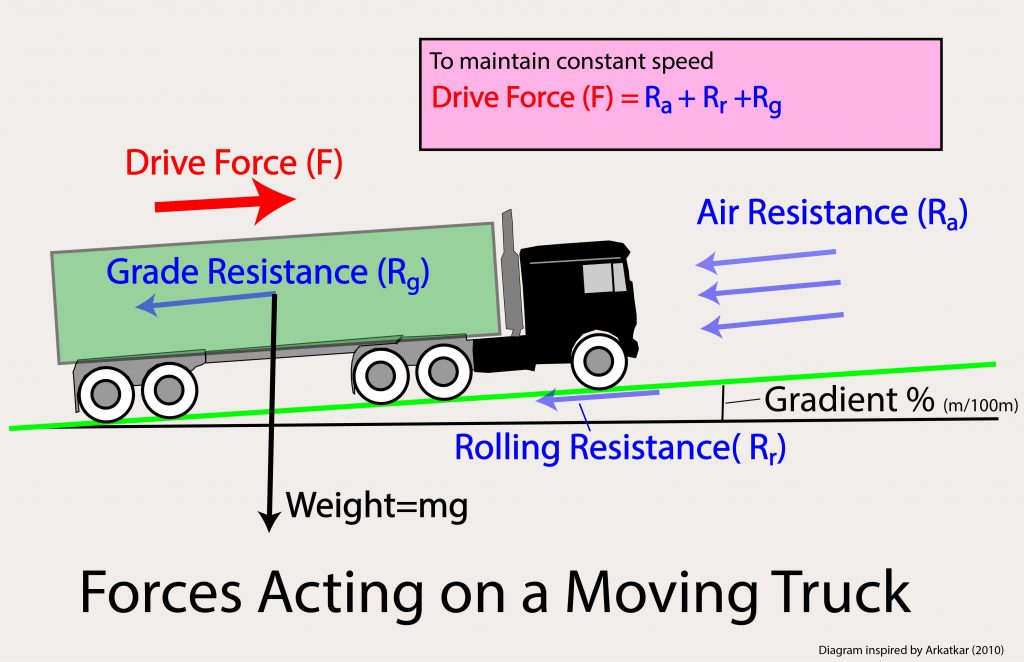
Modelling instantaneous power demands can be done using a vehicle dynamics model proposed by Rakha (2001) for a tractor unit and trailer with a combined load of 40 tonnes. This model allows calculation of the various forces operating on a truck, which include air resistance, rolling resistance from the road surface and grade resistance from gradients. Making assumptions about the typical modern truck, on aspects such as drag coefficient, vehicle frontal surface area, road surface coefficient and tyre rolling resistance, allows us to model the motive force required by the truck under various conditions.

Figure 2 presents the modelled power requirement of a 40 tonne truck at constant speeds from 0-120 km/hour and on different gradients. The modelled gradients were chosen based on UK road design criteria (Highways Agency 2002) which suggest:
• 3% as the maximum gradient for motorways
• 6% as the maximum gradient for all purpose single carriageway roads
• above 8% is considered a departure from standards
Gradients over 8% are extreme and compromises on vehicle load and cruising speed should reasonably be made.

From Figure 2 it is hopefully clear that driving on level ground is much easier than driving up a gradient. A truck that has motive power of 240kW (322 horsepower) could drive quite happily at 96 km/hour (60mph) on the flat but would struggle to make 50km/hour (31 mph) on a 3% gradient. Most of us have experienced being stuck behind a fully loaded HGV as it climbs slowly up an incline and this is the reason why.
1.3 Average Power Over A Typical Journey
Modelling of average power over typical journey cycles can be challenging but a number of studies have modelled the average power demand for trucks over different drive cycles. Mareev (2017) models a 40-tonne truck on German roads with 376kW peak power and average power demand of 100-150kW, depending on road conditions. One of the challenges of modelling is agreeing what the drive cycle should be i.e. should you include the 15 minute period when a local area delivery truck is stationary and part unloading its load. If so then the calculation for average power includes 15 minutes of engine idling and consequently the average figure drops. If the truck is making multiple pick ups and drop offs then the vehicle weight will also fluctuate. For trucks which use regenerative braking (generating and storing electricity when they brake) should this be included?
The average power will come in handy when we explore alternatives to fossil fuel power. For simplicity, it can be assumed that the average power is around the typical operational speed of the truck on a level road.
1.4 Balance of Plant Power Demand
Vehicles require power for more than just providing a tractive force to the wheels. Loads to power items essential to keep the power unit operating, such as
cooling pumps and compressors, are known as BoP loads (or parasitic loads in diesel engine terminology). Diesel parasitic loads often reduce the measured power of the engine, calculated by Brake Thermal Efficiency (BTE), rather than being calculated separately. For our purposes an indicative estimate of BoP for an HGV of circa 30-35kW is made.
1.5 Auxiliary Power Demand
Auxiliary load demand from other truck systems during operation (lighting, driver air-conditioning) are estimated at 3.5kW. (Ballard 2018) although it will depend on the technology. Heating to keep the driver warm will normally be provided for free by a diesel engine but that is not true of a Battery Electric Vehicle (BEV). Supplying power for refrigeration has not been considered here, but would be important for some applications.
1.6 Typical HGV Power Demands
UK HGVs drive 25.6 billion km annually, with 90% of this on motorways/rural A roads with the vast remainder on urban A roads (data for 12 months ending March 2016, Department for Transport 2016). Based on this and the work above , illustrative specifications can be calculated on power units for two ideal specification 40-tonne HGVs operating with different performance requirements:
UK Short-haul HGV Specification: Peak power 468 kW (628 HP), average motive power 173 kW (232 HP).
• Rarely operating on motorways or excessively hilly areas
• Cruising speed of 80km/hour on a 3% gradient and 96km/hour on a 0% gradient.
• Typical operational speed of 80km/hour on an average 0% gradient
Peak power demand = 468kW (429kW motive + 35kW BoP + 3.5kW auxiliary).
Typical power demand = 173kW (139kW motive + 35kW BoP + 3.5kW auxiliary).
UK Long-haul HGV Specification: Peak motive power 759 kW (1,018 HP), average motive power circa 239 kW (321 HP).
• Encountering a variety of different driving conditions anywhere in the UK
• Cruising speed of 80km/hour on 6% gradient and 96km/hour on 3% gradient
• Typical operational speed of 96km/hour on average 0% gradient.
Peak power demand = 759kW (720kW motive + 35kW BoP + 3.5kW auxiliary).
Typical power demand = 239kW (200kW motive + 35kW BoP + 3.5kW auxiliary).
To allow comparison of the technology, four variants of theoretical HGV will be used in future parts of this article:
- Conventional long haul diesel HGV, 373kW (500 horsepower)
- Hydrogen Fuel Cell HGV – 12kWh battery, 40kg hydrogen, 500kW power
- Hydrogen Fuel Cell HGV – 240kWh battery, 60kg hydrogen, 750kW power
- Battery Electric Vehicle (BEV) HGV -1,131kWh battery, 750kW power
Bear in mind that vehicle operators may choose to have lower power engines which reduce capital and operating costs as well as performance when climbing gradients, particularly where they operate on less demanding routes. Producing higher levels of peak power for short duration is less of an issue for fuel cell / battery powertrain vehicles than for diesel and there is little efficiency penalty for having more power available; just the addition of larger electric motors to make use of the extra power. A 373kW diesel engine has highly acceptable performance for the majority of its use and running a higher power engine just for the rare occasions when this is required could adversely affect fuel consumption and operator costs. Most HGVs operate below maximum weight for most of the time; the volume of space available on the trailer is often the restriction.
Part 2 looks at the basic designs of diesel, battery and fuel cell powertrains.
References
Arkatkar (2010). Effect of Gradient and Its Length on Performance of Vehicles under
Heterogeneous Traffic Conditions. Journal of Transportation Engineering. 1120-1136. December
2010
Ballard (2018). Manufacturer’s white paper: Zero Emission Drayage Trucks: (Technology and proven capabilities) [online]. Available at http://blog.ballard.com/fuel-cell-drayage-trucks [Accessed 20 June 18]
Davies (2018). Could Hydrogen Fuelled Trucks Replace Diesel Vehicles Within 10 Years? An initial technical, commercial and policy feasibility assessment of the use of hydrogen fuel cell technology for Heavy Goods Vehicles in the UK to deliver an HGV fleet with near zero emissions by 2050. Masters Dissertation De Montfort University, Faculty of Technology.
Department for Transport (2016). Provisional Road Traffic Estimates Great Britain: April 2015 – March 2016 [online]. Available at
https://www.gov.uk/government/uploads/system/uploads/attachment_data/file/523844/prov-roadtraffic-
estimates-april-2015-to-march-2016.pdf [Accessed 12 May 2017]
Department for Transport (2017). Freight Carbon Review 2017 [online] Available at https://www.gov.uk/government/uploads/system/uploads/attachment_data/file/590922/freightcarbon-
review-2017.pdf [Accessed 7 May 2017]
Highways Agency (2002). Design Manual for Roads & Bridges Volume 6 Section 1 Links. [online]. Available at http://www.standardsforhighways.co.uk/ha/standards/dmrb/vol6/section1/td993.pdf [Accessed 7 July 2018]
Mareev (2017). Battery Dimensioning and Life Cycle Costs Analysis for a Heavy-Duty Truck Considering the Requirements of Long-Haul Transportation, Energies, vol. 11, no. 1, pp. 55.
Rakha (2001). Vehicle Dynamics Model for Predicting Maximum Truck Acceleration Levels. Journal
of Transportation Engineering, 10/2001, Volume 127, Issue 5

Leave a Reply